The short answer: LLM observability means recording a complete trace of every AI request: the prompt actually sent, retrieved context, each model and tool call, tokens, latency, cost, and the final output, linked by one trace ID and tagged with the feature, user and prompt version. With traces in place you can debug a bad answer in minutes, watch cost and quality per feature, catch regressions after a prompt or model change, and turn real failures into evaluation cases. Redact sensitive data before you store it.
A user reports that your AI assistant told them something wrong. You open your logs and find exactly one line: POST /api/chat 200 2.8s.
That's it. You don't know what the user asked, which documents were retrieved, what the final prompt looked like, which model answered, whether a tool was called, or what the tool returned. You try the same question yourself and get a perfectly good answer, because the model is non-deterministic and the context is different. The bug report gets marked "could not reproduce," and the same failure happens again next week.
Traditional application monitoring was built for code that does the same thing every time. Status codes, latency percentiles and error rates tell you whether a service is up. They tell you almost nothing about whether an AI feature is giving good answers, because a request that returns a confident, well-formatted, completely wrong answer looks identical to a perfect one: HTTP 200, two seconds, no exceptions.
LLM observability fills that gap. This guide covers what to capture, how to structure it, what to watch on a dashboard, how to handle the privacy problems it creates, and how it connects to evaluation and cost control. It's written for engineers adding AI features to existing products, not for people building model training infrastructure.
AI features need their own kind of observability
Three properties of LLM features break the assumptions behind normal monitoring.
Failures are semantic, not technical. The most important bugs don't throw exceptions. A hallucinated policy, a refusal on a reasonable request, an answer in the wrong language, or advice that ignores the retrieved document all return success codes. You can only see them by looking at content.
Behaviour depends on everything in the context window. The same user question produces different answers depending on retrieved passages, conversation history, tool results and the exact prompt version. To understand an answer, you need the full input that produced it, not just the user's message.
One request is many steps. A single user message in a RAG system or agent can involve a query rewrite, a search, a rerank, several model calls and a handful of tool calls. A slow or wrong answer could originate in any of them. You need to see the steps and how they relate.
The unit of observability: a trace
The core idea, borrowed from distributed tracing, is to record each request as a trace made of nested spans. The trace represents the whole user interaction. Each span represents one step: a retrieval, a model call, a tool call, a guardrail check. Spans have start and end times, inputs, outputs and metadata, and they nest to show which step called which.
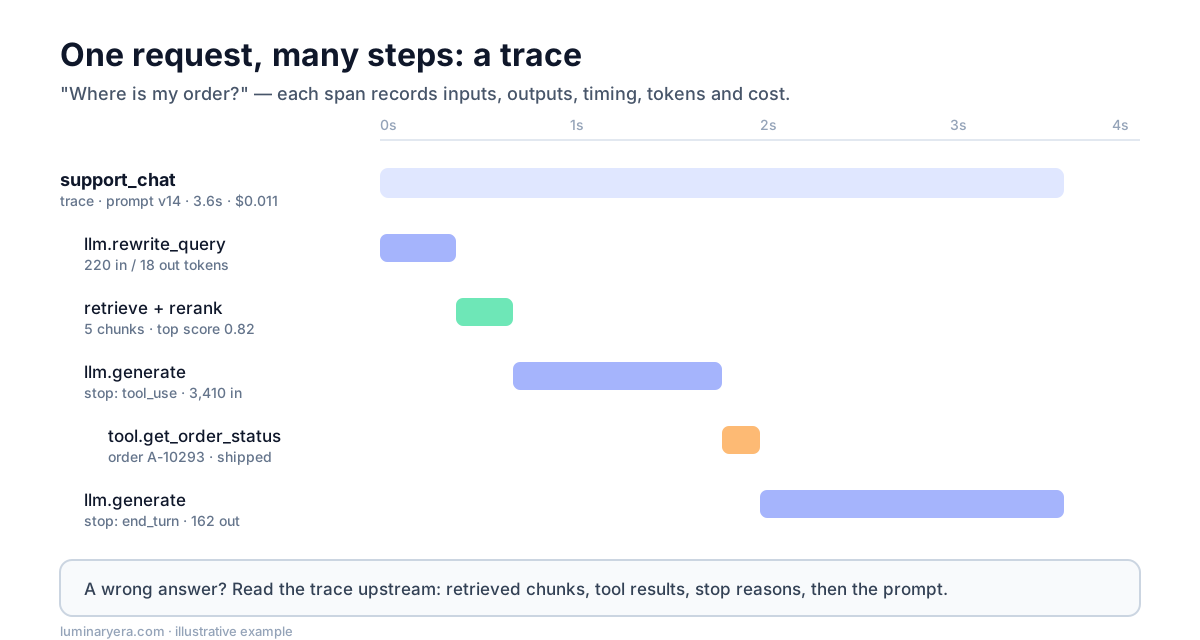
Seen this way, the earlier bug report becomes easy. You open the trace for that request, see that the retrieval span returned a passage from an outdated policy document, and see that the model faithfully summarised it. The model wasn't wrong. The index was. Without the trace, you would probably have spent the afternoon rewriting the prompt.
Capturing the right data in each span
Capture enough to reconstruct exactly what happened. A practical checklist:
| Span type | Capture |
|---|---|
| Every span | Trace ID, span ID, parent span, name, start and end time, status, error message |
| Model call | Provider and model version, the full message list sent, parameters (max tokens, reasoning effort, tools offered), the output, stop reason, input and output tokens, cached tokens, cost |
| Retrieval | The query actually used, the IDs, sources and scores of returned chunks, and which ones were passed to the model |
| Tool call | Tool name, arguments, result (or a truncated version), duration, whether it errored |
| Guardrail or validation | Which check ran, pass or fail, and why |
| Trace level | Feature name, user or session ID (pseudonymous), prompt version, app release, environment, and the final answer shown |
Two fields deserve special emphasis. The prompt version lets you compare quality before and after a prompt change, which is otherwise surprisingly hard to do. The stop reason catches a whole class of bugs on its own: responses cut off at the token limit, refusals, and tool calls the code never handled.
Also record user feedback against the trace when you have it: thumbs up or down, a regenerate click, an escalation to a human, or the user copying the answer. Feedback without the trace behind it tells you something went wrong; feedback attached to the trace tells you what.
Instrumenting your code
You don't need a vendor to start. A thin wrapper around your model calls gets you most of the value. Here's a minimal version in TypeScript that records spans to whatever backend you choose:
import { randomUUID } from "node:crypto";
import { AsyncLocalStorage } from "node:async_hooks";

interface Span {
  traceId: string;
  spanId: string;
  parentId?: string;
  name: string;
  start: number;
  end?: number;
  attributes: Record<string, unknown>;
  status: "ok" | "error";
}

const current = new AsyncLocalStorage<{ traceId: string; spanId: string }>();

export async function withSpan<T>(
  name: string,
  attributes: Record<string, unknown>,
  fn: (span: Span) => Promise<T>,
): Promise<T> {
  const parent = current.getStore();
  const span: Span = {
    traceId: parent?.traceId ?? randomUUID(),
    spanId: randomUUID(),
    parentId: parent?.spanId,
    name,
    start: Date.now(),
    attributes,
    status: "ok",
  };
  try {
    return await current.run({ traceId: span.traceId, spanId: span.spanId }, () => fn(span));
  } catch (err) {
    span.status = "error";
    span.attributes.error = String(err);
    throw err;
  } finally {
    span.end = Date.now();
    exportSpan(span); // send to your tracing backend, asynchronously
  }
}
Using it looks like this:
const answer = await withSpan("support_chat", { feature: "support_chat", promptVersion: "v14" }, async () => {
  const chunks = await withSpan("retrieve", { query }, async (span) => {
    const results = await searchDocs(query);
    span.attributes.chunkIds = results.map((r) => r.id);
    return results;
  });

  return withSpan("llm.generate", { model: MODEL }, async (span) => {
    const res = await callModel(buildPrompt(query, chunks));
    span.attributes.inputTokens = res.usage.inputTokens;
    span.attributes.outputTokens = res.usage.outputTokens;
    span.attributes.stopReason = res.stopReason;
    return res.text;
  });
});
Because the context propagates through AsyncLocalStorage, nested spans attach to the right parent automatically, even across helper functions.
Use OpenTelemetry if you can
Rolling your own is fine to start, but if your organisation already uses OpenTelemetry, use it for AI spans too. OpenTelemetry has semantic conventions for generative AI, which define standard attribute names for things like the model requested and token usage (for example gen_ai.request.model and gen_ai.usage.input_tokens). The conventions are still marked as in development, so expect some churn, but following them means your AI traces sit alongside your database and HTTP traces in the same tools, and you can switch backends later without re-instrumenting.
Several tools are built specifically for LLM traces, including open-source options such as Langfuse and Arize Phoenix, and hosted products from LangSmith, Helicone, Braintrust and the large APM vendors. They add LLM-aware views on top of traces: rendered conversations, prompt diffs, cost roll-ups and evaluation hooks. Pick one that accepts OpenTelemetry data if portability matters to you.
The dashboard: what to actually watch
Once traces are flowing, resist the urge to chart everything. A small set of metrics, broken down by feature and prompt version, covers most needs.
Health
- Error rate by span type, including provider errors, rate limits and timeouts.
- Latency at the median and at the 95th percentile, with time to first token separately for streaming features. Users feel time to first token far more than total time.
- Stop reasons. A rising share of responses ending at the token limit, or ending in refusals, is an early warning.
Cost
- Tokens and cost per request and per feature, with cached input tokens shown separately so you can see whether prompt caching is working.
- Cost per completed task. For agents especially, the number of model and tool calls per task matters more than the cost of any single call. The guide on cutting LLM API costs covers what to do once you can see this.
Quality
- User feedback rate and the share of negative feedback, per feature and prompt version.
- Implicit signals: regenerations, quick follow-up messages like "no, I meant…", abandoned sessions, escalations.
- Online evaluation scores. Run cheap automatic checks on every response (valid format, citations present, no forbidden content) and run a model-graded check on a sample. Track the pass rates over time.
- Retrieval signals for RAG features: how often no relevant chunk is found, and how often answers cite nothing.
The single most useful view is often a simple one: these metrics side by side for the current prompt version and the previous one. Most quality regressions in AI features come from changes you made yourself, such as a prompt edit, a model upgrade or a retrieval tweak, and a before-and-after view catches them within hours instead of weeks.
Alerts that don't cry wolf
Dashboards are for looking; alerts are for being told. The challenge with AI features is that many quality signals are noisy, and an alert that fires every afternoon gets muted within a week. A few principles keep alerting useful.
Alert on rates, not individual events. One negative rating or one refusal means nothing. A refusal rate that doubles over an hour, or a negative feedback rate well above its usual range for a specific feature, is worth waking up for. Compare against the same feature's own recent history rather than a fixed global threshold, because different features have very different normal levels.
Separate hard failures from soft ones. Provider errors, timeouts, responses truncated at the token limit and invalid structured output are unambiguous, and can page someone. Drifting quality scores, rising cost per request and slower time to first token are slower-moving, and belong in a daily or weekly review rather than an urgent alert.
Watch for cost spikes per feature. A bug that sends an agent into a loop, or a change that accidentally breaks prompt caching, can multiply spend within hours. A simple alert on cost per hour per feature, relative to the same hour last week, catches most of these early and is one of the cheapest safeguards you can add.
Make every alert link to example traces. An alert that says "negative feedback up 40% on support_chat" is a starting point. One that links to the ten most recent traces with negative feedback lets the person on call understand the problem in minutes. That link is the whole reason you collected traces in the first place.
Connecting traces to releases
Most changes in an AI feature's behaviour come from changes you made: a new prompt version, a model upgrade, a retrieval tweak, a new tool, or a change to how context is assembled. Make those changes visible in the data.
- Version prompts like code. Store prompts in your repository or a prompt management tool, give each version an identifier, and record that identifier on every trace.
- Record the exact model version. Use pinned model identifiers where your provider offers them, and record what you actually called, so an upstream change doesn't masquerade as your own regression.
- Annotate dashboards with deployments. A vertical line on the chart at each release turns "quality dropped on Tuesday" into "quality dropped right after prompt v15 shipped."
- Roll out gradually when you can. Sending a slice of traffic to the new prompt or model and comparing the two versions side by side, using the same metrics, is far more reliable than comparing this week with last week, when user behaviour also changed.
Together with offline evaluations before release, this gives you two independent checks on every change: the evaluation set says whether it should be better, and production traces say whether it actually is.
Debugging with traces: a workflow
When something goes wrong, work through the trace from the outside in.
- Find the trace. From a support ticket, a negative feedback event or an alert. This is why every user-facing response should carry its trace ID somewhere you can retrieve it, even if only in your logs.
- Read the final answer and the final prompt together. Is the answer wrong given what the model saw? If yes, it's a model or prompt problem. If the answer is reasonable given the context but the context was wrong, the problem is upstream.
- Walk the spans upstream. Check retrieval results, tool results and any query rewriting. Most bad answers turn out to have a bad input somewhere along the way.
- Check the stop reason and token counts. Truncation and context overflow cause a lot of strange behaviour.
- Replay it. Because the trace contains the exact inputs, you can resend the same request, change one thing, and see whether the fix works.
- Save it as a test case. Every real failure is a free evaluation example. Add it to your dataset so the fix stays fixed. The guide on testing LLM features with evals explains how those datasets work.
That last step is where observability pays for itself. Over a few months, your evaluation set fills with the exact situations your users actually hit, which is far more valuable than any synthetic benchmark.
Agents need traces even more
For agents, traces aren't a nice extra; they're the only way to understand what happened. An agent might make fifteen tool calls to finish a task, and the interesting failures are in the sequence: calling the same tool repeatedly with the same arguments, ignoring an error and carrying on, misreading a result, or taking an unnecessary detour that triples the cost.
Useful agent-specific views include the number of steps per task, the most common tool-call sequences, repeated identical calls (a sign of a loop), and tool error rates. Reading a handful of full agent traces each week is one of the most productive habits a team building agents can have; the patterns jump out quickly. The guide to designing tools for AI agents covers what to change once you spot them.
Traces are also your security record. If an agent is ever manipulated by instructions hidden in a document or web page, the trace shows exactly which content entered the context and which actions followed. The guide on prompt injection explains why that matters.
Privacy: traces are sensitive data
Here's the uncomfortable part. A complete trace contains the user's messages, retrieved documents, tool results and model outputs. That can include personal data, confidential documents, credentials pasted by mistake and anything else users type into a chat box. Your observability system can easily become the least protected copy of your most sensitive data.
Treat it accordingly:
- Redact before storing. Strip or mask emails, phone numbers, card numbers, API keys and other obvious secrets at capture time, before data leaves your service. Pattern-based redaction is imperfect, but it removes the most common risks.
- Use pseudonymous IDs for users and sessions rather than names or emails.
- Set retention limits. Keep full content for a short window, long enough to debug recent issues, and keep aggregated metrics longer.
- Restrict access. Not everyone who can see latency dashboards needs to read conversations. Log who views traces.
- Check where the data goes. If you use a hosted observability vendor, it becomes a processor of your users' data. Make sure that's covered by your privacy policy, your contracts and any regional requirements.
- Allow opt-outs where appropriate, for example for enterprise customers who don't want their content stored at all, by recording metadata only.
A sensible default is to capture full content in development and staging, and capture full content in production only for a sampled share of traffic plus every request with negative feedback, with redaction always on.
Sampling and cost of observability itself
Storing every prompt and response for a high-traffic feature gets expensive, and prompts are long. You don't need all of it. Common approaches:
- Always keep metadata (tokens, latency, cost, status, prompt version) for every request. It's small and powers the dashboards.
- Keep full content for a random sample, for every error, for every request with negative feedback, and for every request flagged by an automatic check.
- Raise the sampling rate temporarily after a prompt or model change, when regressions are most likely.
This keeps the debugging power where it matters without paying to store millions of unremarkable successful requests.
Getting started in a week
- Day 1: Wrap every model call and capture model, tokens, latency, stop reason and cost. Add a feature name and prompt version to each request.
- Day 2: Add spans for retrieval and tool calls, linked by a trace ID. Add redaction for obvious secrets and personal data.
- Day 3: Choose where traces go: your existing OpenTelemetry backend or an LLM-specific tool. Build the health and cost views per feature.
- Day 4: Attach user feedback and implicit signals to traces. Add a couple of cheap automatic checks on every response.
- Day 5: Read twenty real traces with the team. Note the failures, fix the obvious ones, and add them to your evaluation set.
By the end of the week, the next "the AI said something wrong" ticket will take minutes to explain instead of an afternoon of guessing.
Frequently asked questions
What is LLM observability?
LLM observability is the practice of recording and analysing what AI features actually do in production: the full prompts, retrieved context, model and tool calls, outputs, tokens, latency, cost and user feedback for each request, linked together as a trace. It lets teams debug wrong answers, monitor quality and cost, and catch regressions after changes.
What should I log for each LLM call?
Log the model and version, the full input messages, key parameters, the output, the stop reason, input, output and cached token counts, latency and cost, plus the trace ID, feature name and prompt version. For RAG and agents, also log retrieved chunk IDs and scores and every tool call's arguments and results. Redact sensitive data before storing it.
Is OpenTelemetry suitable for LLM tracing?
Yes. OpenTelemetry has semantic conventions for generative AI that standardise attributes such as the requested model and token usage. They are still evolving, but using them lets AI spans live alongside the rest of your application traces and keeps you free to change observability backends.
How is LLM monitoring different from normal APM?
Normal application monitoring tracks technical health such as errors, latency and throughput. LLM monitoring also has to track semantic quality, because a wrong or harmful answer usually returns a successful response. That requires capturing content, user feedback and evaluation scores, broken down by feature and prompt version.
How do I handle personal data in LLM traces?
Redact obvious personal data and secrets at capture time, use pseudonymous user IDs, keep full content only for a limited period and for a sample of traffic, restrict who can read conversations, and make sure any observability vendor is covered by your privacy policy and data processing agreements.
The takeaway
AI features fail quietly. They return success codes while giving wrong answers, and the evidence disappears the moment the request ends unless you keep it. Observability is how you keep it: a trace for every request, enough content to understand what the model saw, and metrics split by feature and prompt version so you notice when a change makes things worse.
It isn't glamorous work, but it's what turns "the AI is sometimes weird" into specific, fixable bugs, and every bug you fix becomes a test that keeps the next one from coming back.
Author at LuminaryEra
The LuminaryEra editorial desk publishes long-form, hands-on guides on AI-assisted development, large language models, developer tools and web engineering. Articles are researched and drafted with the help of AI tools, link to their sources, and are corrected when readers report errors.
View all articles